


Service Level Objectives: measurable service quality targets
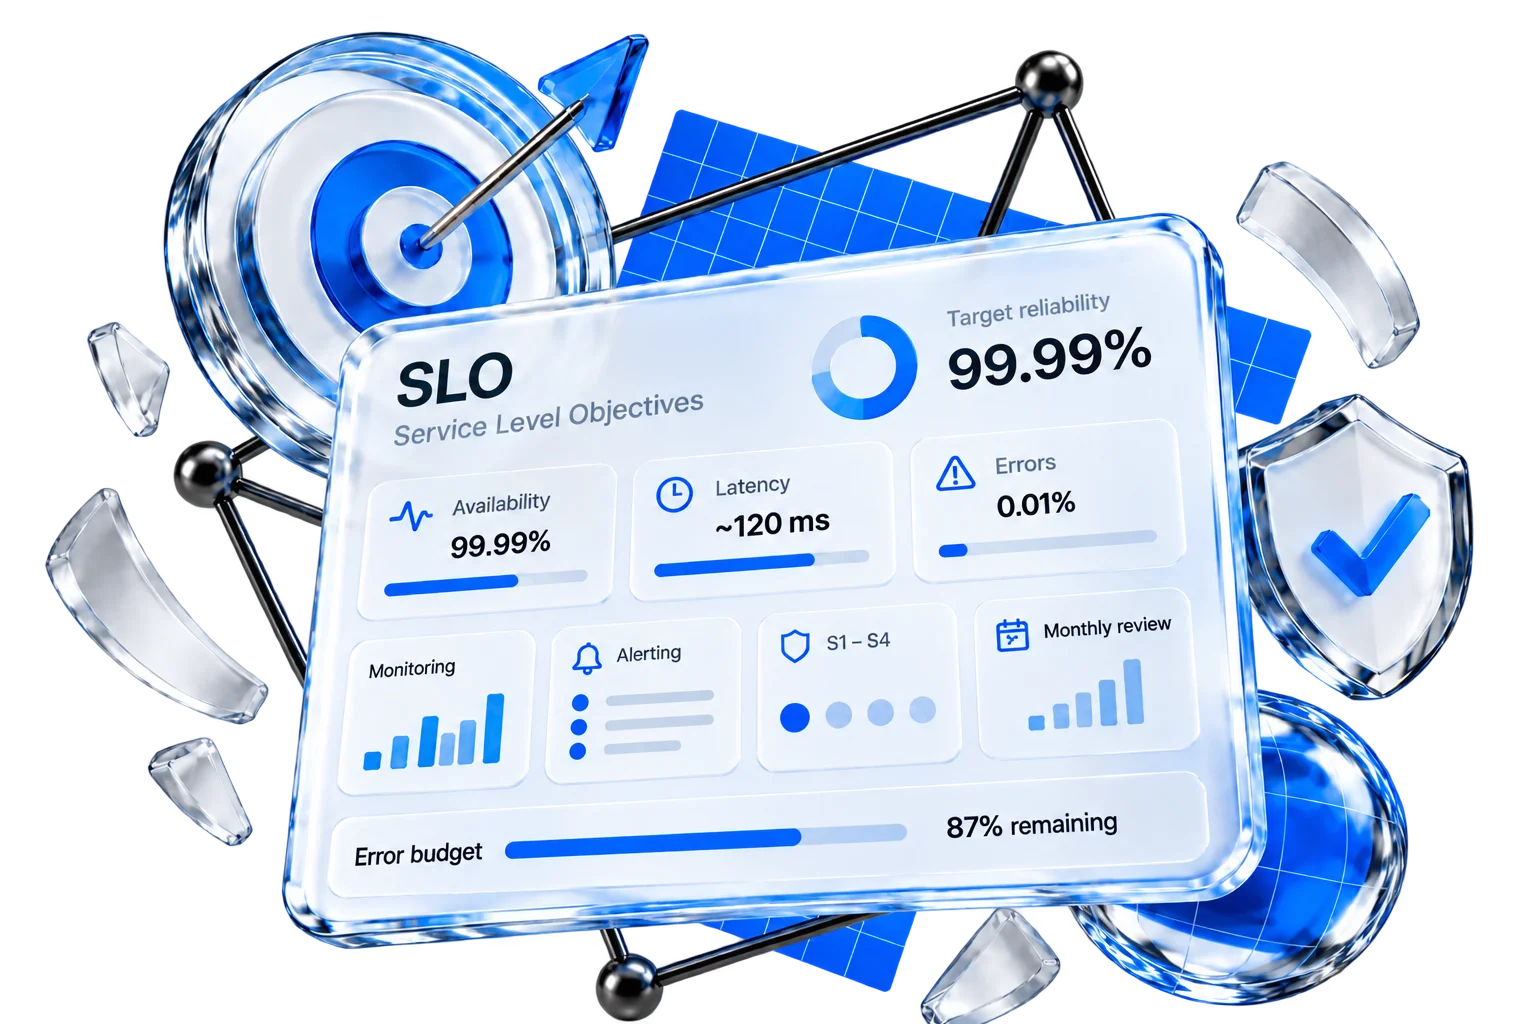
When Webdelo takes on a project for ongoing support, the first step is defining Service Level Objectives (SLOs) — measurable targets for service quality that we commit to maintaining. Specific SLO values are always determined after a project audit and formalized in the Statement of Work (SOW). The standard support package includes multi-layer monitoring, alerting, an S1–S4 incident response model, an error budget, and regular reporting. We do not offer one-size-fits-all uptime numbers. Instead, we define realistic targets and take ownership of meeting them.
 Targets set after an audit, in the SOW
 SLI: availability · latency · errors
 S1–S4 incident model
 Monthly service review
 Grafana · Prometheus · VictoriaMetrics
 Error budget policy
Key facts
SLOs are operational targets, not contractual commitments. Specific values are always set after an audit and fixed in the SOW. We don't publish universal uptime numbers: targets are always tied to the project, its architecture, the service tier, and the support budget.
SLI categories in the standard package
incident severity model
to acknowledge an S1 incident (indicative)
standard service review cadence

Targets come after the audit
No SLOs are set without an audit. Realistic targets come after analyzing the architecture, load, and service tiers.

SOW
Specific SLO values, error budgets, response times, and reporting cadence are set out in an annex to the contract.

Grafana · Prometheus · VictoriaMetrics
Our primary stack. Alternatives (Datadog, New Relic, and others) by agreement with the client.

Three different things
An SLI is a metric. An SLO is a target for that metric. An SLA is a contract. SLOs live in the SOW; the SLA is a separate document.

It drives priorities
When the budget is exhausted, feature work stops and the team shifts to reliability.

Zero incidents · 24/7 by default
We minimize the impact of incidents; round-the-clock coverage depends on the plan and service tier.
Terminology: SLI · SLO · SLA · SOW · Error budget
The core vocabulary we use in discussions and documents. An SLI is what gets measured. An SLO is the target for that metric. An SLA is a legal document. The SOW is the technical specification where the concrete numbers are fixed.

 Error budget
Scope: what's covered and what isn't
SLOs apply to the systems and layers we observe and control. External services, planned maintenance windows, and force majeure events fall outside our targets by default.
 In scope

Web applications and APIs with defined service tiers
Microservice architectures and distributed systems
High-load analytics platforms and data processing pipelines
Financial and trading systems, internal fintech/banking tooling
Marketing automation and ERP modules
Infrastructure layer: servers, containers, databases, network services
 Out of scope

Third-party services and APIs outside the client's or Webdelo's control (payment gateways, external providers)
Planned maintenance windows agreed in advance
Degradation caused by client-side changes outside the agreed change management process
Force majeure events beyond reasonable technical control
What drives SLO parameters
Webdelo's approach recognizes that SLO targets are shaped by three factors. Together they determine how deep the monitoring goes, how strict the thresholds are, and who responds and how.

Architectural complexity
A single-database monolith and a twenty-service distributed system require fundamentally different monitoring approaches. More complex architectures require more observation points and broader on-call coverage.

Service tier
Not all system components carry equal business weight. We classify services by tier based on their impact on the availability of the client's core product. A payment gateway and an internal report-generation service warrant very different response requirements. The tier determines monitoring priority, response times, and on-call team composition.

Support budget
Budget determines how many specialists can be allocated, their working mode (business hours, extended hours, or 24/7 coverage), and the depth of business-metric monitoring.
When SLOs are established
SLOs are defined at one of two stages. The ideal scenario is monitoring built into the architecture from the start. On existing projects, observability is built up incrementally after an audit.

New service builds
Monitoring and metrics are built into the architecture from the start. By launch time, full observability coverage is already in place — the ideal scenario.

Onboarding to an existing project
Webdelo conducts an infrastructure audit, establishes service tiers, identifies monitoring gaps, and builds observability incrementally. Concrete SLO values are fixed in the SOW following the audit.
In both cases, error budgets are defined for key metrics to guide prioritization decisions between feature development and stability work.
SLIs: what we measure
Seven measurement categories covered by the standard package. Thresholds are set per project, but the categories and the approach stay the same.
 Availability
 Errors
 Latency
 Resources
 Databases
 Network endpoints
 Business metrics

A real-world example: business-metric monitoring


On one project, Webdelo configured monitoring for order status transition times. Metrics revealed that a subset of orders was getting stuck at specific processing stages. Investigation uncovered a compounded failure: support confirmation flow misfires + external delivery API latency spikes = accumulation of stalled orders = database overload = system-wide degradation. Each component appeared healthy in isolation; the cascade was only visible through business-level metrics.
Standard SLO package: five components
Every Webdelo support engagement includes five core components. The specific tools and thresholds are configurable.

Monitoring infrastructure. Primary stack: Grafana + Prometheus (or equivalent tools agreed with the client). Coverage spans all seven SLI categories: availability, errors, latency, resources, databases, network dependencies, and business processes.

Alerting system. Alerting is built on VictoriaMetrics (or equivalent). Every alert is tied to a specific metric threshold and severity level. Notifications are delivered to the team's messaging channel (Slack, Telegram, or as agreed). On-call engineers receive only actionable signals — low-priority noise is filtered out.

Runbooks and escalation paths. For each service we maintain a responsibility map: who gets paged for which incident, escalation order, and initial response steps to execute before a domain specialist joins. This eliminates the “who owns this?” delay at the moment an incident fires.

Incident management team. The incident team operates across three levels: incident management — specialists with full project architecture knowledge who open incidents, create tickets in the project management system (Jira, ClickUp, or the client's preferred tool), and assign ownership; on-call DevOps/SysOps — infrastructure engineers for diagnosing issues at the server, container, network, and orchestration level; on-call developers — service-specific engineers engaged when an issue is localized to application code or business logic.

User-reported issue channel. We establish a channel for client-side employees to report observed anomalies. End users often detect issues before automated alerts fire. All reports are consolidated, triaged, and routed into the standard incident workflow.
Incident severity model: S1–S4
A four-level severity model. The times shown are indicative; final parameters depend on the service tier, on-call mode, and budget, and are fixed in the SOW.

Specific response times depend on service tier, on-call mode, and support budget. Final parameters are fixed in the SOW.
Error Budget Policy
The error budget is the allowable amount of service degradation within a measurement period (typically monthly or quarterly). The state of the budget directly determines where the team spends its time: on features or on stability.
Budget healthy
Remaining budget is above the warning threshold. The team maintains its standard delivery pace — feature development and infrastructure changes proceed normally.
Budget approaching exhaustion
Remaining budget is below the warning threshold. Priorities shift toward stability. New feature work pauses until the budget recovers or the SLO is renegotiated with the client.
Budget exhausted
Feature work stops entirely. The team focuses exclusively on reliability restoration. A joint review is conducted with the client to analyze root causes and update the plan.
Reporting and service reviews
Regular reporting gives the client visibility into SLIs, error budget status, and the reliability trend. Standard reporting cadence is monthly. Weekly or quarterly formats are available by agreement.
Periodic report contents
SLO status
Error budget
 Incidents
 Trends
 Recommendations

Post-incident process
Every incident generates a task documenting root causes, affected systems, and remediation steps taken. Related bug-fix and logic-correction tickets are linked to this task. The resulting task cluster forms the foundation for postmortem review and longitudinal team performance analysis.
Cadence
regular service review
for high-tier systems
QBR format
What we do not promise
Clear capability boundaries are part of how Webdelo builds trust with clients. It's better to state plainly where our guarantees end than to sign up for numbers we can't sustain.

No universal SLO numbers
We do not publish or commit to “99.99% for everything” before an audit. Targets are always project-specific.
Third-party dependencies are outside our control
We monitor external APIs and services but cannot guarantee their availability.
SLO is not SLA
SLOs are operational targets, not legally binding commitments. Legal consequences for violations are defined in a separate SLA.
24/7 on-call is not the default
Round-the-clock coverage depends on budget and service tier. Standard packages may cover extended business hours only.
Zero incidents are not guaranteed
We work to prevent incidents and minimize their impact. We do not promise they will not occur.
Business-metric monitoring requires explicit agreement
Monitoring business processes requires a separate scope agreement covering which metrics to track and data access arrangements.
